面積圖
面積圖又叫區域圖。它是在折線圖的基礎之上形成的, 它將折線圖中折線與自變量坐標軸之間的區域使用顏色或者紋理填充,這樣一個填充區域我們叫做面積,顏色的填充可以更好的突出趨勢信息。
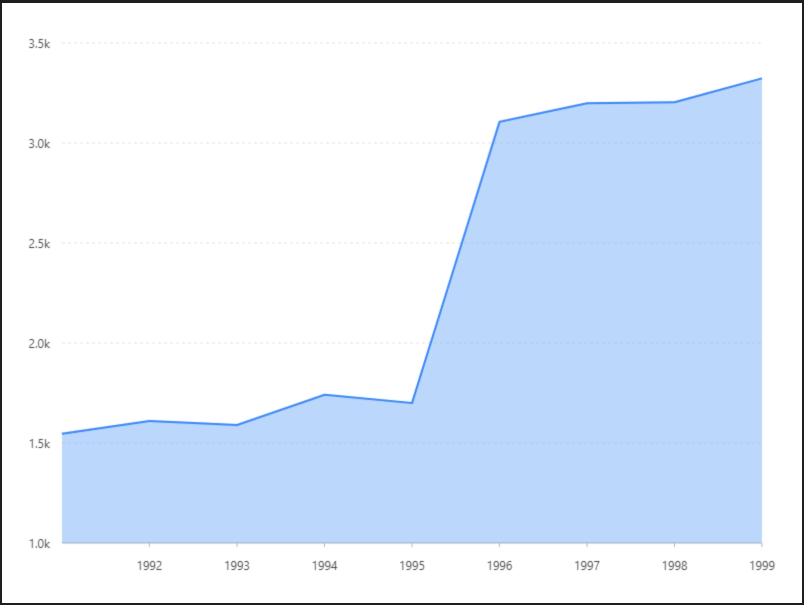
基礎面積圖
面積圖用於估計數量隨時間而變化的程度,也可用於引起人們對總值趨勢的注意。他們最常用於表現趨勢和關係,而不是傳達特定的值。
預覽圖
設定值
-
資料源
[{
  year: '1991',
  value: 15468
}, {
  year: '1992',
  value: 16100
}, {
  year: '1993',
  value: 15900
}, {
  year: '1994',
  value: 17409
}, {
  year: '1995',
  value: 17000
}, {
  year: '1996',
  value: 31056
}, {
  year: '1997',
  value: 31982
}, {
  year: '1998',
  value: 32040
}, {
  year: '1999',
  value: 33233
}]-
內距
40,40, 60, 60-
比例尺 Scale
year 比例尺 ( X軸 )
| 列表 | 設定值 |
| 欄位 |
year |
|
類型 |
linear |
| 刻度間距 | 1 |
| 優化數據範圍 | 開啟 |
value 比例尺 ( Y軸 )
| 列表 | 設定值 |
| 欄位 | value |
| 類型 | linear |
| 優化數據範圍 | 開啟 |
| 最小值 | 10000 |
| 最大值 | 35000 |
| 格式化函數 |
|
-
圖 Geom
區域圖( area )
| 列表 | 設定值 |
| 欄位 | year*value |
| 類型 | 區域圖 |
線圖( Line )
| 列表 | 設定值 |
| 欄位 |
year*value |
| 類型 | 線圖 |
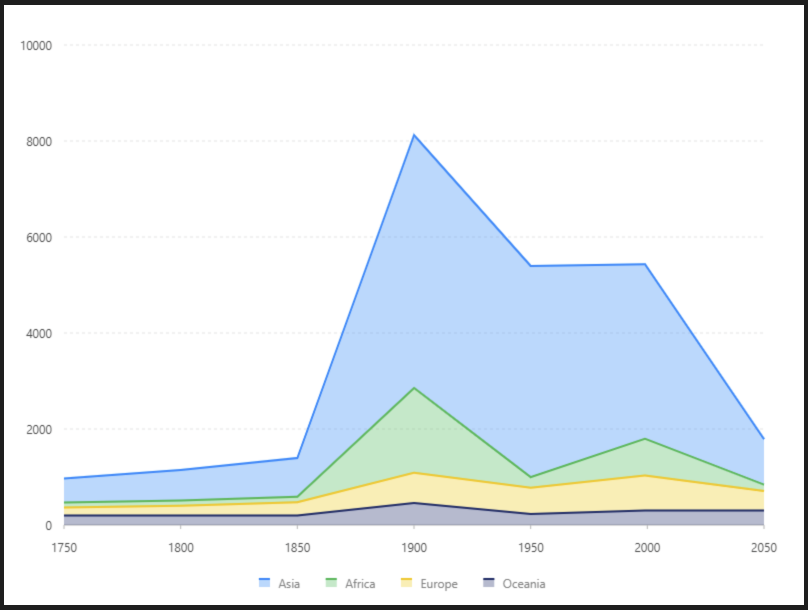
堆疊面積圖
和基本面積圖一樣,唯一的區別就是圖上每一個數據集的起點不同,起點是基於前一個數據集的,用於顯示每個數值所佔大小隨時間或類別變化的趨勢線,展示的是部分與整體的關係。
層疊面積圖上的最大的面積代表了所有的數據量的總和,是一個整體。各個疊起來的面積表示各個數據量的大小,這些堆疊起來的面積圖在表現大數據的總量分量的變化情況時格外有用,所以層疊面積圖不適用於表示帶有負值的數據集。非常適用於對比多變量隨時間變化的情況。
預覽圖
設定值
-
資料源
[{
  country: 'Asia',
  year: '1750',
  value: 502
}, {
  country: 'Asia',
  year: '1800',
  value: 635
}, {
  country: 'Asia',
  year: '1850',
  value: 809
}, {
  country: 'Asia',
  year: '1900',
  value: 5268
}, {
  country: 'Asia',
  year: '1950',
  value: 4400
}, {
  country: 'Asia',
  year: '1999',
  value: 3634
}, {
  country: 'Asia',
  year: '2050',
  value: 947
}, {
  country: 'Africa',
  year: '1750',
  value: 106
}, {
  country: 'Africa',
  year: '1800',
  value: 107
}, {
  country: 'Africa',
  year: '1850',
  value: 111
}, {
  country: 'Africa',
  year: '1900',
  value: 1766
}, {
  country: 'Africa',
  year: '1950',
  value: 221
}, {
  country: 'Africa',
  year: '1999',
  value: 767
}, {
  country: 'Africa',
  year: '2050',
  value: 133
}, {
  country: 'Europe',
  year: '1750',
  value: 163
}, {
  country: 'Europe',
  year: '1800',
  value: 203
}, {
  country: 'Europe',
  year: '1850',
  value: 276
}, {
  country: 'Europe',
  year: '1900',
  value: 628
}, {
  country: 'Europe',
  year: '1950',
  value: 547
}, {
  country: 'Europe',
  year: '1999',
  value: 729
}, {
  country: 'Europe',
  year: '2050',
  value: 408
}, {
  country: 'Oceania',
  year: '1750',
  value: 200
}, {
  country: 'Oceania',
  year: '1800',
  value: 200
}, {
  country: 'Oceania',
  year: '1850',
  value: 200
}, {
  country: 'Oceania',
  year: '1900',
  value: 460
}, {
  country: 'Oceania',
  year: '1950',
  value: 230
}, {
  country: 'Oceania',
  year: '1999',
  value: 300
}, {
  country: 'Oceania',
  year: '2050',
  value: 300
}]-
內距
40,40, 80, 60-
比例尺 Scale
year 比例尺 ( X軸 )
| 列表 | 設定值 |
| 欄位 |
year |
|
類型 |
linear |
| 刻度間距 | 50 |
| 優化數據範圍 | 開啟 |
-
圖 Geom
區域圖( area )
| 列表 | 設定值 |
| 欄位 | year*value |
| 類型 | 區域圖 |
| 顏色欄位 | country |
| 調整欄位 | 堆疊 | stack |
線圖( Line )
| 列表 | 設定值 |
| 欄位 |
year*value |
| 類型 | 線圖 |
|
顏色欄位 |
country |
| 大小 | 2 |
|
調整欄位 |
堆疊 | stack |
-
圖示 Legend
| 列表 | 設定值 |
| 啟用 | 開啟 |
| 欄位 | country |
| 位置 | 下 |
| 排版 | 水平 |
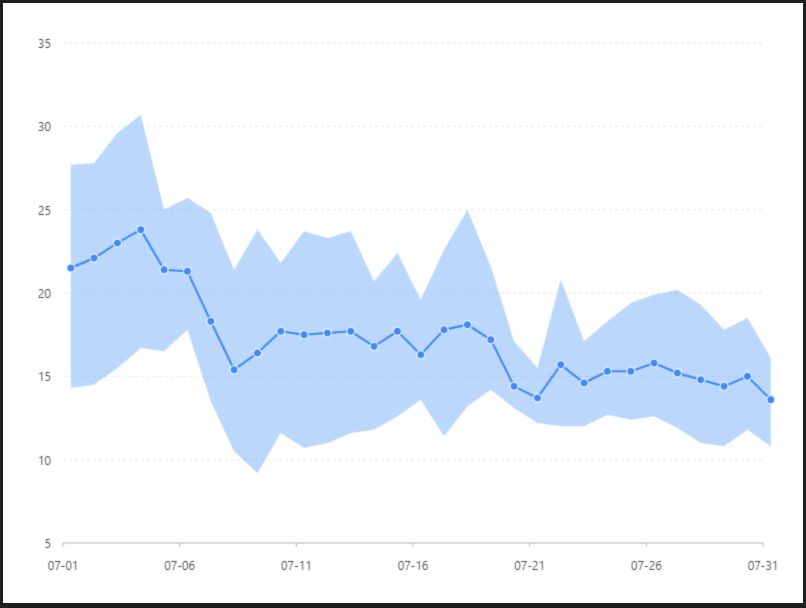
區間面積圖
預覽圖
設定值
-
資料源
[{
  time: 1246406400000,
  constest: 21.5,
  temperature: [14.3, 27.7]
}, {
  time: 1246492800000,
  constest: 22.1,
  temperature: [14.5, 27.8]
}, {
  time: 1246579200000,
  constest: 23,
  temperature: [15.5, 29.6]
}, {
  time: 1246665600000,
  constest: 23.8,
  temperature: [16.7, 30.7]
}, {
  time: 1246752000000,
  constest: 21.4,
  temperature: [16.5, 25.0]
}, {
  time: 1246838400000,
  constest: 21.3,
  temperature: [17.8, 25.7]
}, {
  time: 1246924800000,
  constest: 18.3,
  temperature: [13.5, 24.8]
}, {
  time: 1247011200000,
  constest: 15.4,
  temperature: [10.5, 21.4]
}, {
  time: 1247097600000,
  constest: 16.4,
  temperature: [9.2, 23.8]
}, {
  time: 1247184000000,
  constest: 17.7,
  temperature: [11.6, 21.8]
}, {
  time: 1247270400000,
  constest: 17.5,
  temperature: [10.7, 23.7]
}, {
  time: 1247356800000,
  constest: 17.6,
  temperature: [11.0, 23.3]
}, {
  time: 1247443200000,
  constest: 17.7,
  temperature: [11.6, 23.7]
}, {
  time: 1247529600000,
  constest: 16.8,
  temperature: [11.8, 20.7]
}, {
  time: 1247616000000,
  constest: 17.7,
  temperature: [12.6, 22.4]
}, {
  time: 1247702400000,
  constest: 16.3,
  temperature: [13.6, 19.6]
}, {
  time: 1247788800000,
  constest: 17.8,
  temperature: [11.4, 22.6]
}, {
  time: 1247875200000,
  constest: 18.1,
  temperature: [13.2, 25.0]
}, {
  time: 1247961600000,
  constest: 17.2,
  temperature: [14.2, 21.6]
}, {
  time: 1248048000000,
  constest: 14.4,
  temperature: [13.1, 17.1]
}, {
  time: 1248134400000,
  constest: 13.7,
  temperature: [12.2, 15.5]
}, {
  time: 1248220800000,
  constest: 15.7,
  temperature: [12.0, 20.8]
}, {
  time: 1248307200000,
  constest: 14.6,
  temperature: [12.0, 17.1]
}, {
  time: 1248393600000,
  constest: 15.3,
  temperature: [12.7, 18.3]
}, {
  time: 1248480000000,
  constest: 15.3,
  temperature: [12.4, 19.4]
}, {
  time: 1248566400000,
  constest: 15.8,
  temperature: [12.6, 19.9]
}, {
  time: 1248652800000,
  constest: 15.2,
  temperature: [11.9, 20.2]
}, {
  time: 1248739200000,
  constest: 14.8,
  temperature: [11.0, 19.3]
}, {
  time: 1248825600000,
  constest: 14.4,
  temperature: [10.8, 17.8]
}, {
  time: 1248912000000,
  constest: 15,
  temperature: [11.8, 18.5]
}, {
  time: 1248998400000,
  constest: 13.6,
  temperature: [10.8, 16.1]
}]-
內距
40,40, 60, 60-
比例尺 Scale
time(X軸)
| 列表 | 設定值 |
| 欄位 |
time |
|
類型 |
time |
| 優化數據範圍 | 開啟 |
| 時間格式 | MM-DD |
constest(Y軸 )
| 列表 | 設定值 |
| 欄位 | constest |
| 類型 | linear |
| 優化數據範圍 | 開啟 |
| 最小值 | 5 |
| 最大值 | 35 |
temperature( Y軸 )
| 列表 | 設定值 |
| 欄位 | temperature |
| 類型 | linear |
| 優化數據範圍 | 開啟 |
| 最小值 | 5 |
| 最大值 | 35 |
-
軸座標 Axis
constest( Y軸 )
| 列表 | 設定值 |
| 欄位 | constest |
| 啟用 | 關閉 |
-
圖 Geom
區域圖( area )
| 列表 | 設定值 |
| 欄位 | time*temperature |
| 類型 | 區域圖 |
線圖( Line )
| 列表 | 設定值 |
| 欄位 |
time*constest |
| 類型 | 線圖 |
| 大小 | 2 |
點圖( point )
| 列表 | 設定值 |
| 欄位 | time*constest |
| 類型 | 點圖 |
| 形狀 | circle |
| 樣式 - 顏色 | #ffffff |
| 樣式 - 寬度 | 1 |
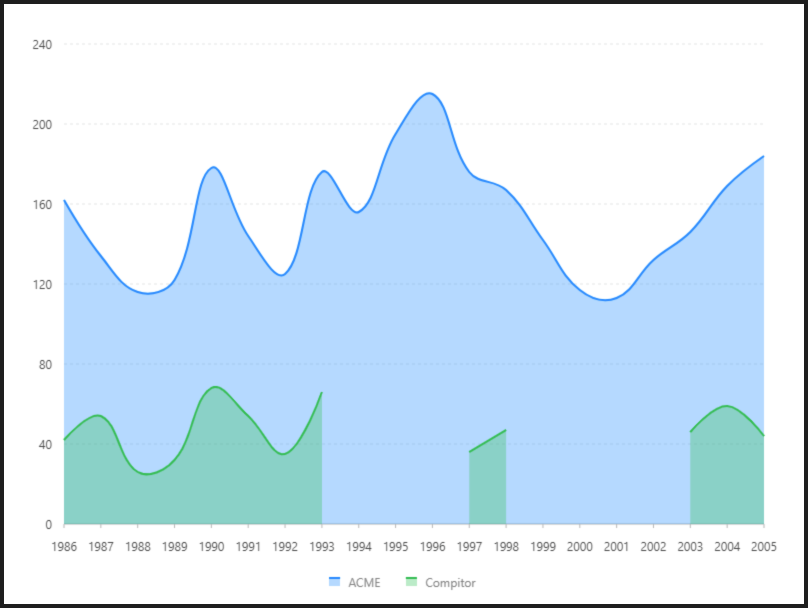
片段面積圖
預覽圖
設定值
-
資料源
[{
  time: 1246406400000,
  constest: 21.5,
  temperature: [14.3, 27.7]
}, {
  time: 1246492800000,
  constest: 22.1,
  temperature: [14.5, 27.8]
}, {
  time: 1246579200000,
  constest: 23,
  temperature: [15.5, 29.6]
}, {
  time: 1246665600000,
  constest: 23.8,
  temperature: [16.7, 30.7]
}, {
  time: 1246752000000,
  constest: 21.4,
  temperature: [16.5, 25.0]
}, {
  time: 1246838400000,
  constest: 21.3,
  temperature: [17.8, 25.7]
}, {
  time: 1246924800000,
  constest: 18.3,
  temperature: [13.5, 24.8]
}, {
  time: 1247011200000,
  constest: 15.4,
  temperature: [10.5, 21.4]
}, {
  time: 1247097600000,
  constest: 16.4,
  temperature: [9.2, 23.8]
}, {
  time: 1247184000000,
  constest: 17.7,
  temperature: [11.6, 21.8]
}, {
  time: 1247270400000,
  constest: 17.5,
  temperature: [10.7, 23.7]
}, {
  time: 1247356800000,
  constest: 17.6,
  temperature: [11.0, 23.3]
}, {
  time: 1247443200000,
  constest: 17.7,
  temperature: [11.6, 23.7]
}, {
  time: 1247529600000,
  constest: 16.8,
  temperature: [11.8, 20.7]
}, {
  time: 1247616000000,
  constest: 17.7,
  temperature: [12.6, 22.4]
}, {
  time: 1247702400000,
  constest: 16.3,
  temperature: [13.6, 19.6]
}, {
  time: 1247788800000,
  constest: 17.8,
  temperature: [11.4, 22.6]
}, {
  time: 1247875200000,
  constest: 18.1,
  temperature: [13.2, 25.0]
}, {
  time: 1247961600000,
  constest: 17.2,
  temperature: [14.2, 21.6]
}, {
  time: 1248048000000,
  constest: 14.4,
  temperature: [13.1, 17.1]
}, {
  time: 1248134400000,
  constest: 13.7,
  temperature: [12.2, 15.5]
}, {
  time: 1248220800000,
  constest: 15.7,
  temperature: [12.0, 20.8]
}, {
  time: 1248307200000,
  constest: 14.6,
  temperature: [12.0, 17.1]
}, {
  time: 1248393600000,
  constest: 15.3,
  temperature: [12.7, 18.3]
}, {
  time: 1248480000000,
  constest: 15.3,
  temperature: [12.4, 19.4]
}, {
  time: 1248566400000,
  constest: 15.8,
  temperature: [12.6, 19.9]
}, {
  time: 1248652800000,
  constest: 15.2,
  temperature: [11.9, 20.2]
}, {
  time: 1248739200000,
  constest: 14.8,
  temperature: [11.0, 19.3]
}, {
  time: 1248825600000,
  constest: 14.4,
  temperature: [10.8, 17.8]
}, {
  time: 1248912000000,
  constest: 15,
  temperature: [11.8, 18.5]
}, {
  time: 1248998400000,
  constest: 13.6,
  temperature: [10.8, 16.1]
}]-
內距
40, 40, 80, 60-
前置處理函數 Transform
字串展開( fold )
| 列表 | 設定值 |
| 類型 | 字串展開 |
| 要展開的欄位 | ACME,Compitor |
| 保留欄位 |
year |
| key | type |
| Value | value |
-
比例尺 Scale
year( X軸 )
| 列表 | 設定值 |
| 欄位 | year |
| 類型 | linear |
| 刻度間距 | 1 |
| 優化數據範圍 | 開啟 |
-
圖 Geom
區域圖( area )
| 列表 | 設定值 |
| 欄位 | year*value |
| 類型 | 區域圖 |
|
顏色欄位 |
type |
| 形狀 | smooth |
線圖( Line )
| 列表 | 設定值 |
| 欄位 |
year*value |
| 類型 | 線圖 |
| 顏色欄位 | type |
| 形狀 | smooth |
| 大小 | 2 |
-
圖示 Legend
| 列表 | 設定值 |
| 啟用 | 開啟 |
| 欄位 | type |
| 位置 | 下 |
| 排版 | 水平 |
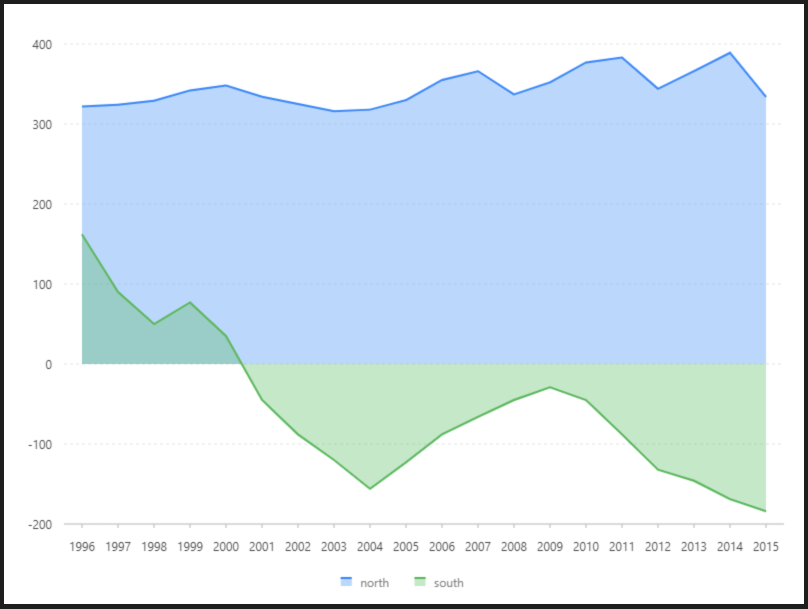
正負面積圖
預覽圖
設定值
-
資料源
[{
  year: '1996',
  north: 322,
  south: 162
}, {
  year: '1997',
  north: 324,
  south: 90
}, {
  year: '1998',
  north: 329,
  south: 50
}, {
  year: '1999',
  north: 342,
  south: 77
}, {
  year: '2000',
  north: 348,
  south: 35
}, {
  year: '2001',
  north: 334,
  south: -45
}, {
  year: '2002',
  north: 325,
  south: -88
}, {
  year: '2003',
  north: 316,
  south: -120
}, {
  year: '2004',
  north: 318,
  south: -156
}, {
  year: '2005',
  north: 330,
  south: -123
}, {
  year: '2006',
  north: 355,
  south: -88
}, {
  year: '2007',
  north: 366,
  south: -66
}, {
  year: '2008',
  north: 337,
  south: -45
}, {
  year: '2009',
  north: 352,
  south: -29
}, {
  year: '2010',
  north: 377,
  south: -45
}, {
  year: '2011',
  north: 383,
  south: -88
}, {
  year: '2012',
  north: 344,
  south: -132
}, {
  year: '2013',
  north: 366,
  south: -146
}, {
  year: '2014',
  north: 389,
  south: -169
}, {
  year: '2015',
  north: 334,
  south: -184
}]-
內距
40, 20, 80, 60-
前置處理函數 Transform
字串展開( fold )
| 列表 | 設定值 |
| 類型 | 字串展開 |
| 要展開的欄位 | north,south |
| 保留欄位 |
year |
| key | type |
| Value | value |
-
圖 Geom
區域圖( area )
| 列表 | 設定值 |
| 欄位 | year*value |
| 類型 | 區域圖 |
|
顏色欄位 |
type |
線圖( Line )
| 列表 | 設定值 |
| 欄位 |
year*value |
| 類型 | 線圖 |
| 顏色欄位 | type |
| 大小 | 2 |
-
圖示 Legend
| 列表 | 設定值 |
| 啟用 | 開啟 |
| 欄位 | value |
| 位置 | 下 |
| 排版 | 水平 |