| 列表 | 設定值 |
| 欄位 | height\*weight |
| 類型 | 點圖 |
| 形狀 | circle |
| 列表 | 設定值 |
| 欄位 | height\*weight |
| 類型 | 點圖 |
| 顏色欄位 | gender |
| 形狀參數 | circle |
| 大小參數 | 4 |
| 列表 | 設定值 |
| 欄位 | height\*weight |
| 類型 | 點圖 |
| 顏色欄位 | gender |
| 形狀 | gender |
| 形狀參數 | circle,diamond |
| 大小參數 | 4 |
圖片僅供參考,此點圖會浮動
### 預覽圖 --- #### [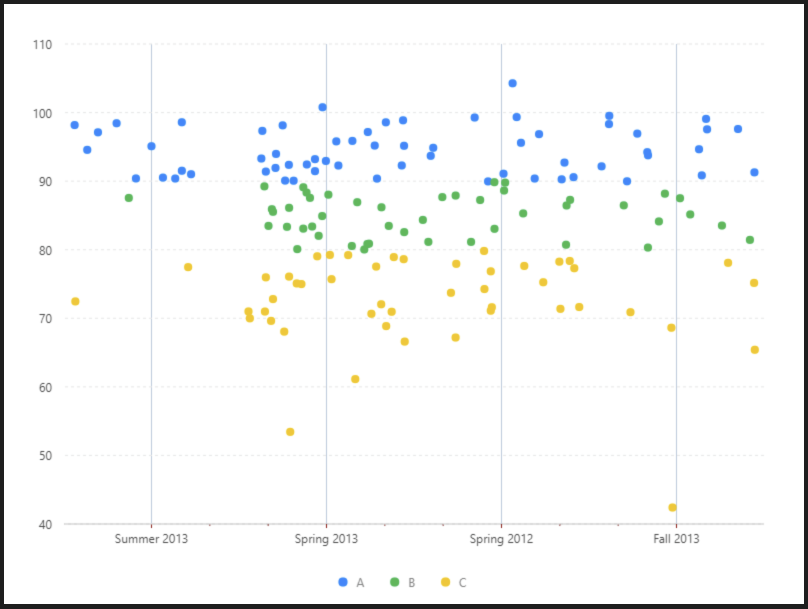](https://book.gosu.bar/uploads/images/gallery/2019-12/bJSD39bNrWXH0VzB-%E6%93%BE%E5%8B%95%E9%BB%9E%E5%9C%96.png) ### 設定值 --- - #### 資料源 - [AntV](https://g2.antv.vision/zh/examples/point/scatter#jitter) ``` https://g2.antv.vision/zh/examples/data/dv-grades.json ( 資料來源:AntV ) 格式: [ {Class: "Summer 2013",Grade: "C",Score: 72.5,}, {Class: "Summer 2013",Grade: "C",Score: 77.5,}, ...... ] ``` - #### 內距 ``` 40, 40, 60, 60 ``` - #### 比例尺 Scale ##### Class(X軸)| 列表 | 設定值 |
| 欄位 | Class |
| 類型 | cat |
| 刻度數量 | 5 |
| 優化數據範圍 | 開啟 |
| 列表 | 設定值 |
| 欄位 | Score |
| 啟用 | 開啟 |
| 位置 | left |
| 列表 | 設定值 |
| 欄位 | Class |
| 啟用 | 開啟 |
| 刻度現 - 顏色 | \#A14242 |
| 次要刻度 - 數量 | 2 |
| 次要刻度 - 顏色 | \#A14242 |
| 列表 | 設定值 |
| 欄位 | Class\*Score |
| 類型 | 點圖 |
| 顏色欄位 | Grade |
| 形狀 | circle |
| 大小參數 | 4 |
| 調整欄位 | 擾動 | Jitter |
| 列表 | 設定值 |
| 啟用 | 開啟 |
| 欄位 | Class |
| 位置 | 下 |
| 排版 | 水平 |
圖片僅供參考,此點圖會浮動
### 預覽圖 --- #### [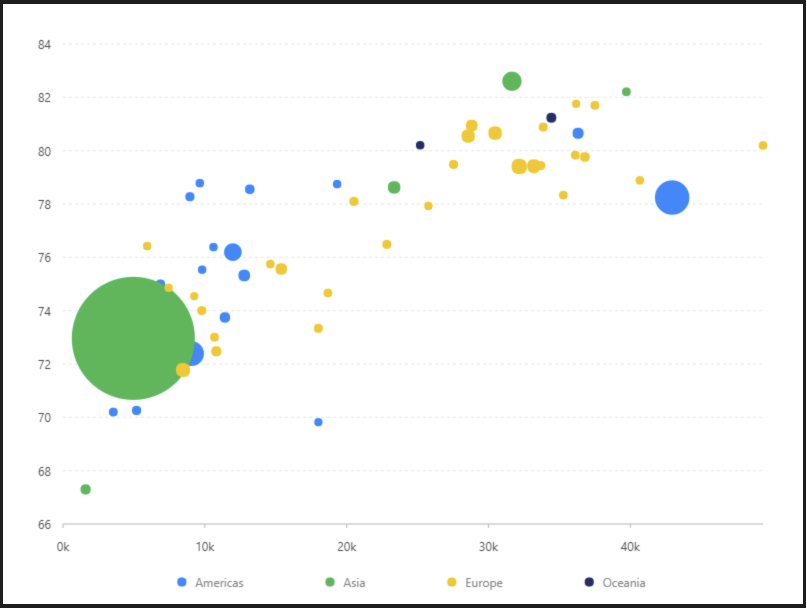](https://book.gosu.bar/uploads/images/gallery/2019-12/gpgc3kbeGTaRRHRY-%E6%B0%A3%E6%B3%A1%E5%9C%96.png) ### 設定值 --- - #### 資料源 - [AntV](https://g2.antv.vision/zh/examples/point/scatter#bubble) ``` https://g2.antv.vision/zh/examples/data/bubble.json ( 資料來源:AntV ) 格式: [ {continent: "Americas",Country: "Argentina",LifeExpectancy: 75.32,GDP: 12779.37964,Population: 40301927,}, {continent: "Americas",Country: "Brazil",LifeExpectancy: 72.39,GDP: 9065.800825,Population: 190010647,}, ...... ] ``` - #### 內距 ``` 40, 40, 60, 60 ``` - #### 比例尺 Scale ##### GDP(X軸)| 列表 | 設定值 |
| 欄位 | GDP |
| 類型 | linear |
| 優化數據範圍 | 開啟 |
| 最小值 | 0 |
| 格式化函數 | ```
function formatter(value) { return (value / 1000).toFixed(0) + 'k'; } ``` |
| 列表 | 設定值 |
| 欄位 | GDP\*LifeExpectancy |
| 類型 | 點圖 |
| 顏色欄位 | continent |
| 形狀 | circle |
| 大小欄位 | Population |
| 大小參數 | 4,65 |
| 調整欄位 | 擾動 | Jitter |
| 列表 | 設定值 |
| 啟用 | 開啟 |
| 欄位 | Population |
| 位置 | 下 |
| 排版 | 水平 |
| 水平偏移量 | 140 |
| 水平間距 | 80 |