# 單色南丁格爾玫瑰圖
南丁格爾玫瑰圖,又名雞冠花圖、極坐標區域圖,是南丁格爾在克里米亞戰爭期間提交的一份關於士兵死傷的報告時發明的一種圖表,是在極坐標下繪製的柱狀圖,使用圓弧的半徑長短表示數據的大小(數量的多少)。
由於半徑和面積的關係是平方的關係,南丁格爾玫瑰圖會將數據的比例大小誇大,尤其適合對比大小相近的數值;由於圓形有周期的特性,所以玫瑰圖也適用於表示一個週期內的時間概念,比如星期、月份。
### 預覽圖
---
[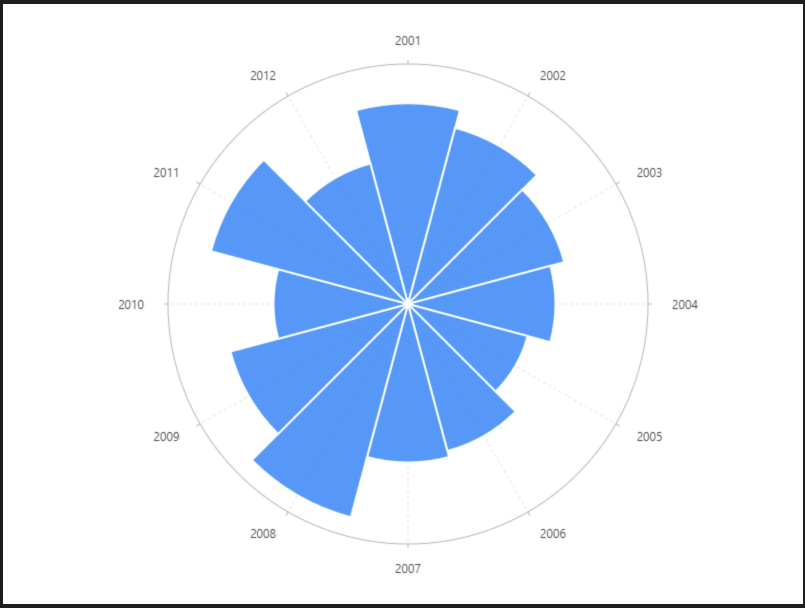](https://book.gosu.bar/uploads/images/gallery/2019-12/8sWkFsNW586LdBYk-%E5%96%AE%E8%89%B2%E5%8D%97%E4%B8%81%E6%A0%BC%E7%88%BE%E7%8E%AB%E7%91%B0%E5%9C%96.png)
### 設定值
---
- #### 資料源
```
[{
year: '2001',
population: 41.8
}, {
year: '2002',
population: 38
}, {
year: '2003',
population: 33.7
}, {
year: '2004',
population: 30.7
}, {
year: '2005',
population: 25.8
}, {
year: '2006',
population: 31.7
}, {
year: '2007',
population: 33
}, {
year: '2008',
population: 46
}, {
year: '2009',
population: 38.3
}, {
year: '2010',
population: 28
}, {
year: '2011',
population: 42.5
}, {
year: '2012',
population: 30.3
}]
```
- #### 內距
```
60, 40, 60, 50
```
- #### 軸座標 Axis
##### population( Y軸 )
- #### 圖 Geom
##### 柱狀圖( interval )
| 列表 | 設定值 |
| 欄位 | year\*population
|
| 類型 | 柱狀圖 |
| 樣式 - 顏色 | \#ffffff |
| 樣式 - 寬度 | 2 |
- #### 極坐標 Coord