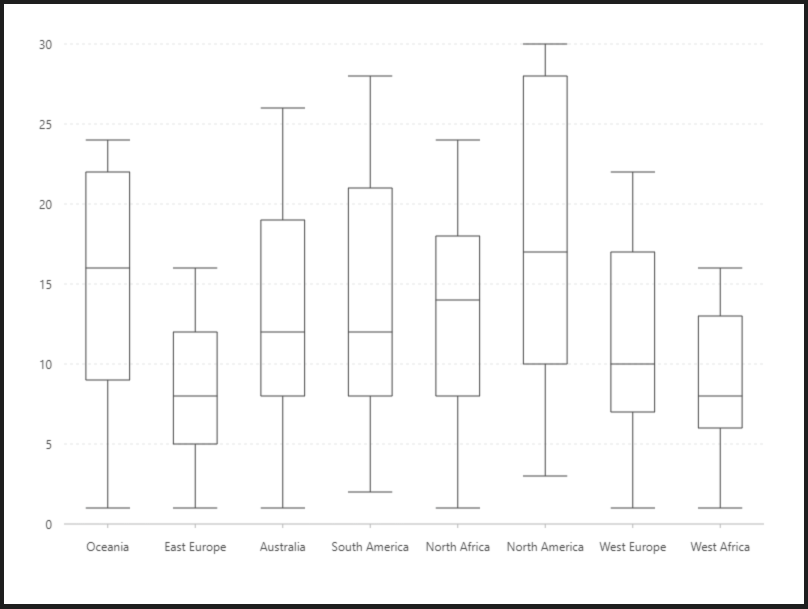
基礎箱型圖
雙折線圖,用於比對兩組數據的趨勢。如果一個數據集中包含了一個分類變量和一個或者多個連續變量,那麼你可能會想知道連續變量會如何隨著分類變量水平的變化而變化,而箱形圖就可以提供這種方法,它只用了5個數字對分佈進行概括,即一組數據的最大值、最小值、中位數、下四分位數及上四分位數。對於數據集中的異常值,通常會以單獨的點的形式繪製。箱形圖可以水平或者垂直繪製。箱形圖多用於數值統計,雖然相比於直方圖和密度曲線較原始簡單,但是它不需要佔據過多的畫布空間,空間利用率高,非常適用於比較多組數據的分佈情況。
預覽圖
設定值
-
資料源
[{
  "month":x: "Jan"'Oceania',
  "city":low: "Tokyo",1,
  "temperature":q1: 79,
  median: 16,
  q3: 22,
  high: 24
}, {
  "month":x: "Jan"'East Europe',
  "city":low: "London",1,
  "temperature":q1: 3.95,
  median: 8,
  q3: 12,
  high: 16
}, {
  "month":x: "Feb"'Australia',
  "city":low: "Tokyo",1,
  "temperature":q1: 6.98,
  median: 12,
  q3: 19,
  high: 26
}, {
  "month":x: "Feb"'South America',
  "city":low: "London",2,
  "temperature":q1: 4.28,
  median: 12,
  q3: 21,
  high: 28
}, {
  "month":x: "Mar"'North Africa',
  "city":low: "Tokyo",1,
  "temperature":q1: 9.58,
  median: 14,
  q3: 18,
  high: 24
}, {
  "month":x: "Mar"'North America',
  "city":low: "London",3,
  "temperature":q1: 5.710,
  median: 17,
  q3: 28,
  high: 30
}, {
  "month":x: "Apr"'West Europe',
  "city":low: "Tokyo",1,
  "temperature":q1: 14.57,
  median: 10,
  q3: 17,
  high: 22
}, {
  "month":x: "Apr"'West Africa',
  "city":low: "London",1,
  "temperature":q1: 8.56,
  },median: {8,
  "month":q3: "May",13,
  "city":high: "Tokyo",
  "temperature": 18.4
}, {
  "month": "May",
  "city": "London",
  "temperature": 11.9
}, {
  "month": "Jun",
  "city": "Tokyo",
  "temperature": 21.5
}, {
  "month": "Jun",
  "city": "London",
  "temperature": 15.2
}, {
  "month": "Jul",
  "city": "Tokyo",
  "temperature": 25.2
}, {
  "month": "Jul",
  "city": "London",
  "temperature": 17
}, {
  "month": "Aug",
  "city": "Tokyo",
  "temperature": 26.5
}, {
  "month": "Aug",
  "city": "London",
  "temperature": 16.6
}, {
  "month": "Sep",
  "city": "Tokyo",
  "temperature": 23.3
}, {
  "month": "Sep",
  "city": "London",
  "temperature": 14.2
}, {
  "month": "Oct",
  "city": "Tokyo",
  "temperature": 18.3
}, {
  "month": "Oct",
  "city": "London",
  "temperature": 10.3
}, {
  "month": "Nov",
  "city": "Tokyo",
  "temperature": 13.9
}, {
  "month": "Nov",
  "city": "London",
  "temperature": 6.6
}, {
  "month": "Dec",
  "city": "Tokyo",
  "temperature": 9.6
}, {
  "month": "Dec",
  "city": "London",
  "temperature": 4.816
}]-
內距
40,20,50,5040,80,60-
比例尺前置處理函數ScaleTransform
temperature數據加工( 比例尺 ( X軸map )
| 列表 | 設定值 |
temperature
類型
function
最小值
0
格式化函數
function(val)callback(obj) {
obj.range = [obj.low, obj.q1, obj.median, obj.q3, obj.high];
return valobj;}+ '°C'; }
-
圖 Geom
點圖(K線圖( pointschema )
| 列表 | 設定值 |
| 欄位 | |
| 類型 |
|
#ffffff
線圖( Line )
city#545454