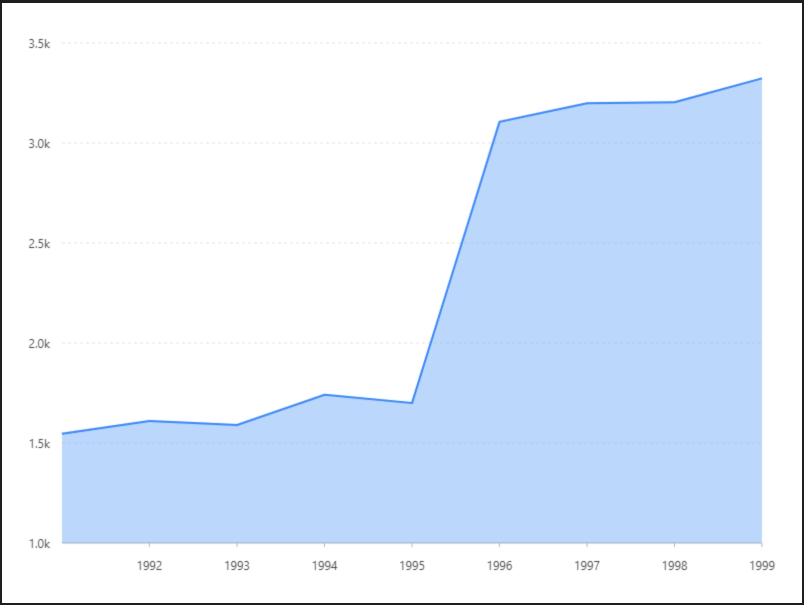
基礎面積圖
雙折線圖,用於比對兩組數據的趨勢。面積圖用於估計數量隨時間而變化的程度,也可用於引起人們對總值趨勢的注意。他們最常用於表現趨勢和關係,而不是傳達特定的值。
預覽圖
設定值
-
資料源
[{
  "month":year: "Jan"'1991',
  "city":value: "Tokyo",
  "temperature": 715468
}, {
  "month":year: "Jan"'1992',
  "city":value: "London",
  "temperature": 3.916100
}, {
  "month":year: "Feb"'1993',
  "city":value: "Tokyo",
  "temperature": 6.915900
}, {
  "month":year: "Feb"'1994',
  "city":value: "London",
  "temperature": 4.217409
}, {
  "month":year: "Mar"'1995',
  "city":value: "Tokyo",
  "temperature": 9.517000
}, {
  "month":year: "Mar"'1996',
  "city":value: "London",
  "temperature": 5.731056
}, {
  "month":year: "Apr"'1997',
  "city":value: "Tokyo",
  "temperature": 14.531982
}, {
  "month":year: "Apr"'1998',
  "city":value: "London",
  "temperature": 8.532040
}, {
  "month":year: "May"'1999',
  "city":value: "Tokyo",
  "temperature": 18.4
}, {
  "month": "May",
  "city": "London",
  "temperature": 11.9
}, {
  "month": "Jun",
  "city": "Tokyo",
  "temperature": 21.5
}, {
  "month": "Jun",
  "city": "London",
  "temperature": 15.2
}, {
  "month": "Jul",
  "city": "Tokyo",
  "temperature": 25.2
}, {
  "month": "Jul",
  "city": "London",
  "temperature": 17
}, {
  "month": "Aug",
  "city": "Tokyo",
  "temperature": 26.5
}, {
  "month": "Aug",
  "city": "London",
  "temperature": 16.6
}, {
  "month": "Sep",
  "city": "Tokyo",
  "temperature": 23.3
}, {
  "month": "Sep",
  "city": "London",
  "temperature": 14.2
}, {
  "month": "Oct",
  "city": "Tokyo",
  "temperature": 18.3
}, {
  "month": "Oct",
  "city": "London",
  "temperature": 10.3
}, {
  "month": "Nov",
  "city": "Tokyo",
  "temperature": 13.9
}, {
  "month": "Nov",
  "city": "London",
  "temperature": 6.6
}, {
  "month": "Dec",
  "city": "Tokyo",
  "temperature": 9.6
}, {
  "month": "Dec",
  "city": "London",
  "temperature": 4.833233
}]-
內距
40,20,50,5040, 60, 60-
比例尺 Scale
temperatureyear 比例尺 ( X軸 )
| 列表 | 設定值 |
| 欄位 |
|
|
類型 |
linear |
function(val) { return val + '°C'; }-
圖 Geom
點圖( point )
| 列表 | 設定值 |
| 欄位 | month*temperature |
| 類型 | 點圖 |
| 顏色欄位 | city |
| 形狀 | circle |
| 大小 | 4 |
| 樣式 - 顏色 |
#ffffff |
| 樣式 - 寬度 | 1 |
線圖( Line )
| 列表 | 設定值 |
| 欄位 | month*temperature |
| 類型 | 線圖 |
| 顏色欄位 |
city |