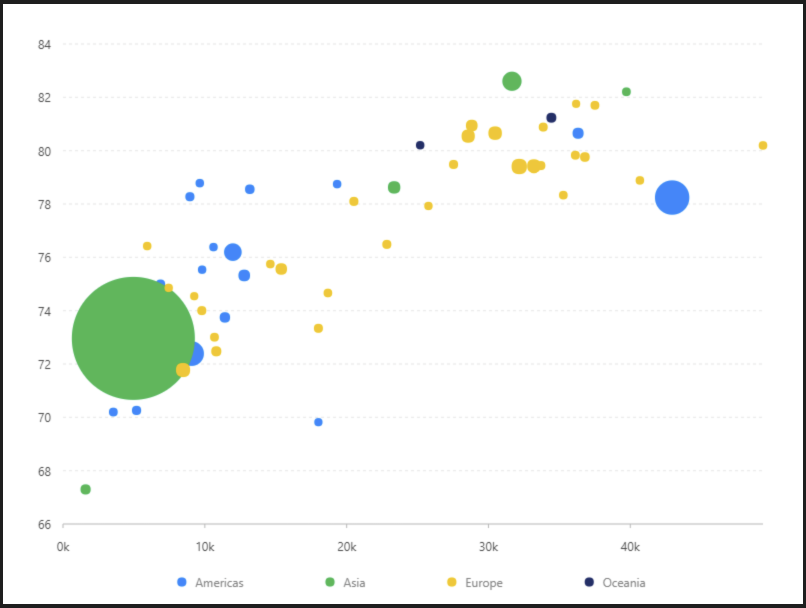
氣泡圖
圖片僅供參考,此點圖會浮動
預覽圖
設定值
-
資料源 - AntV
https://g2.antv.vision/zh/examples/data/bubble.json
( 資料來源:AntV )
格式:
[
{continent: "Americas",Country: "Argentina",LifeExpectancy: 75.32,GDP: 12779.37964,Population: 40301927,},
{continent: "Americas",Country: "Brazil",LifeExpectancy: 72.39,GDP: 9065.800825,Population: 190010647,},
......
]-
內距
40, 40, 60, 60-
比例尺 Scale
Class(
GDP(X軸)
| 列表 | 設定值 |
| 欄位 | |
| 類型 |
linear
軸座標 Axis
Score( X軸 )
function formatter(value) {
Class( Y軸 )}
-
圖 Geom
點圖(point)
| 列表 | 設定值 |
| 欄位 |
|
| 類型 | 點圖 |
| 顏色欄位 | |
| 形狀 | circle |
| 大小欄位 |
Population
大小參數-
圖示 Legend
| 列表 | 設定值 |
| 啟用 | 開啟 |
| 欄位 | |
| 位置 | 下 |
| 排版 | 水平 |
140
水平間距80